Quantitative Research · 210 Events · 2010–2024

S&P 500 Index Effect

Event Study of Market Microstructure Around Index Inclusion  ·  OLS Market Model  ·  Short Strategy Simulation

Post-Inclusion CAR
Days 0 to +20
Volume Spike
Day −1 Abnormal Volume
Sharpe Ratio
Short Strategy
Win Rate
Strategy 1
Scroll to explore

Event Study Design

We apply a standard market model event study across 210 S&P 500 addition events from February 2010 to December 2024, isolating abnormal returns from market-wide movements using OLS regression on a pre-event estimation window.

📊

Dataset

300 S&P 500 additions scraped from Wikipedia (2010–2024). After filtering for sufficient price history and excluding one corrupted observation (CBE, 2011), the final sample contains 210 addition events across all 11 GICS sectors. Price and volume data sourced from Yahoo Finance.

📈

Market Model

For each event, we run OLS regression of daily stock returns on S&P 500 index returns over an estimation window of days −60 to −21 (40 trading days). This yields event-specific α and β parameters. Mean β across events = 1.14; mean R² = 0.30.

🗓️

Event Window

Abnormal returns are computed over days −20 to +20 relative to each stock's effective S&P 500 inclusion date. Average Abnormal Returns (AAR) are calculated cross-sectionally each day; cumulative AARs form the CAR trajectory.

ARi,t = Ri,t − (αi + βi × Rmarket,t)
AARt = (1/N) Σ ARi,t   // average across N events each day
CAR(t1,t2) = Σ AARt   // cumulative sum over event window

Trading Day Windows

Estimation Window (−60 → −21)
Pre-Event (−20 → −1)
Post-Inclusion (0 → +20)
−60−21−200 (Inclusion)+20

Abnormal Return Dynamics

Contrary to classical "buy the announcement" intuition, index additions show no pre-inclusion run-up. Instead, a persistent and statistically significant underperformance of −4.79% unfolds over the 20 trading days following inclusion.

Cumulative Abnormal Return (CAR)

210 events · 95% confidence band · red dots = significant days (p<0.05)
Pre-inclusion CAR (days −20 to −1): −0.93% (not significant)  |  Post-inclusion CAR (days 0 to +20): −4.79%

Daily Average Abnormal Return (AAR)

Crimson = significant & negative  ·  Coral = insignificant & negative  ·  Blue = positive
Pre-period: 1/20 significant days (random chance)  |  Post-period: 9/21 significant days, all negative
−4.79%
Post-Inclusion CAR
Days 0 to +20
−0.93%
Pre-Inclusion CAR
Days −20 to −1
67.1%
Events with
Negative Post-CAR
No front-running, persistent correction. The pre-period is statistically flat — index arbitrageurs are not bidding up prices in advance of the effective date. The underperformance begins at day 0 and accumulates gradually across all 21 post-inclusion days. 9 of 21 post-inclusion days are individually significant at the 5% level, all negative, suggesting a broad structural decline rather than a single-day shock.

Post-Inclusion CAR Distribution & Temporal Pattern

Left: histogram of individual-event CARs (days 0→+20) · Right: annual mean CARs showing time-varying strength of the effect

Mean post-CAR = −4.77% · Median = −3.64% · Min = −57.3% · Max = +42.5% · Effect strongest in 2010–2011, weakest in 2015–2019, re-emerging 2020–2024

Trading Volume Around Inclusion

A massive volume spike of +1,813% on the day before effective inclusion reveals intense index fund front-running activity. Elevated volume persists for 20+ days as passive funds complete their rebalancing.

Average Abnormal Trading Volume (AAV)

Winsorized at 99th percentile · Bars colored by statistical significance (p<0.05) · Day −1 bar is off-scale — actual value +1,813% annotated
Day −1 spike truncated at display scale. Actual AAV = +1,813% (t = 22.94, N = 210). Top individual events on day −1: EVRG (+9,500%), NDSN (+8,700%), ROL (+8,200%). Day 0 AAV = +456%; significant elevation persists through day +20.

Does Volume Predict Returns?

Pre-event abnormal volume (days −5 to −1) vs post-inclusion CAR (days 0 to +20) · N = 210 events
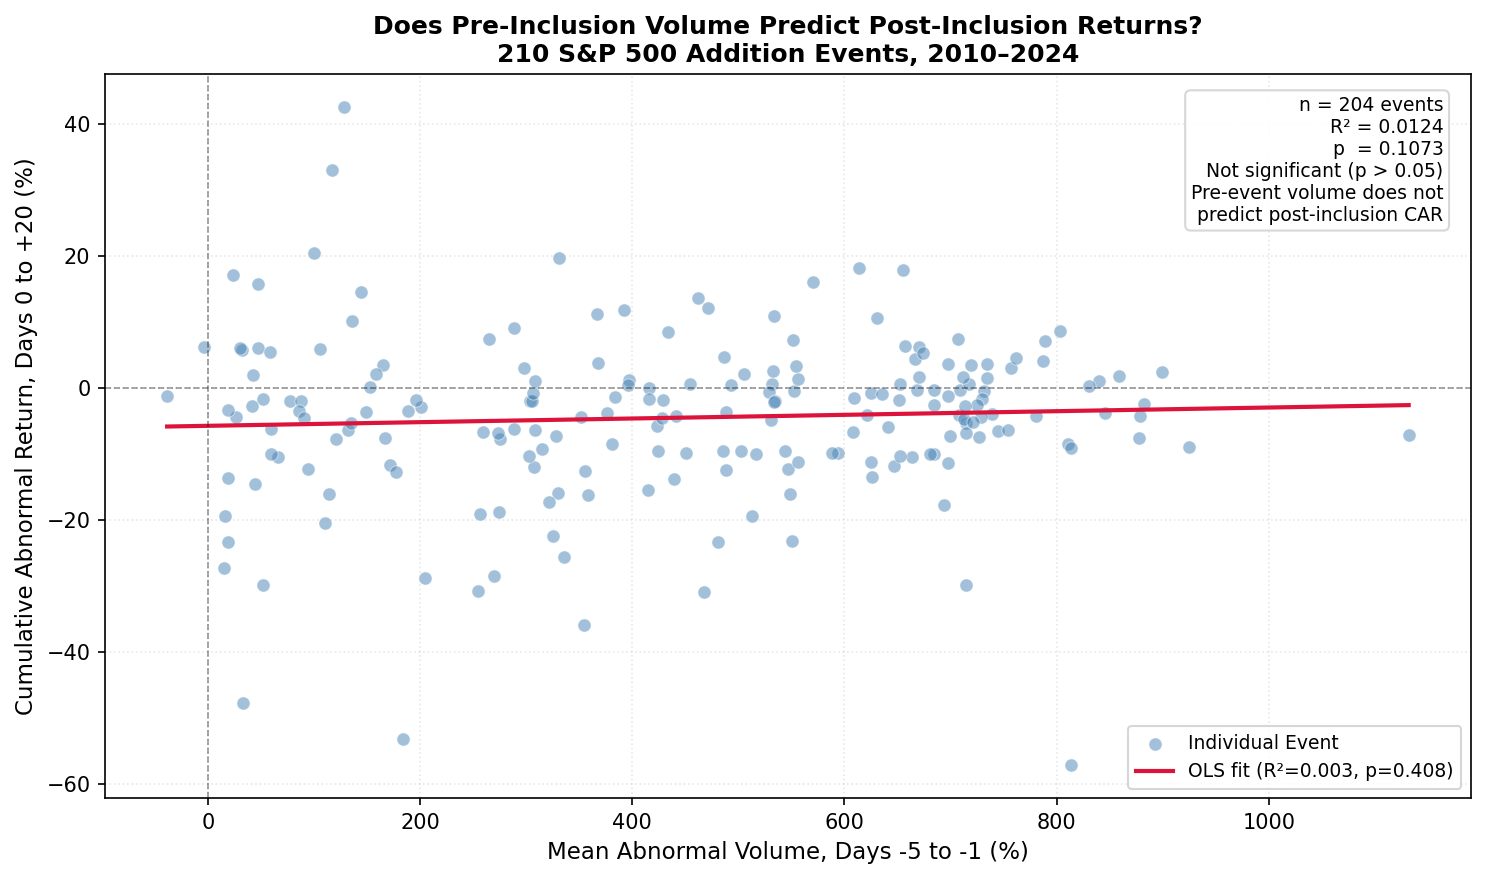
Volume vs Return scatter plot
R² = 0.012 · Slope = 0.005 · p = 0.107 (not significant)

Volume Mechanism Identified

The day −1 spike is driven by anticipatory trading ahead of the known effective inclusion date. Index funds must buy the newly-added stock; their predictable demand is front-run by active traders. The buildup begins as early as day −5 (+58% abnormal volume) and accelerates sharply into day −1.

Volume Does NOT Predict Return Magnitude

Despite the dramatic volume spike, pre-event volume levels have no statistically significant relationship with post-inclusion underperformance (R² = 1.24%, p = 0.107). Volume is a symptom of the structural demand change, not a signal of how large the price correction will be.

Persistence of Elevated Volume

34 of 41 event-window days show statistically significant abnormal volume. Post-inclusion, volume remains elevated through day +20 as index funds continue accumulating the new addition — a multi-week process reflecting the scale of passive fund rebalancing.
Short Strategy Simulation

A long-short strategy that systematically shorts each newly-added stock at inclusion and covers 20 days later delivers a Sharpe ratio of 1.343 and a 67.9% win rate over 209 trades — highly significant at p < 0.0001. Returns are measured as abnormal returns (market-model adjusted) to isolate the index-addition effect.

Preferred ★
Strategy 1: Short at Day 0, Cover at Day +20
Entry on effective date close · 20-day holding period · 209 completed trades
1.343
Sharpe Ratio (gross)
67.9%
Win Rate
4.58%
Mean Return (gross)
4.38%
Mean Return (net, 20bps)
3.50%
Median Return
−54.2%
Max Drawdown
✓ t-stat = 5.47 · p-value < 0.0001 · Highly significant
Strategy 2: Short at Day −5, Cover at Day +20
Entry 5 days before effective date · 25-day holding period · 210 completed trades
1.023
Sharpe Ratio (gross)
63.8%
Win Rate
4.89%
Mean Return (gross)
4.69%
Mean Return (net, 20bps)
3.46%
Median Return
−65.6%
Max Drawdown
✓ t-stat = 4.66 · p-value < 0.0001 · Highly significant

Cumulative Strategy Performance — All Trades in Chronological Order

Arithmetic sum of per-trade abnormal returns · Sorted by effective inclusion date · Strategy 1 (blue) vs Strategy 2 (coral dashed)
Strategy 1 (steelblue) preferred over Strategy 2 for higher Sharpe (1.343 vs 1.023), higher win rate (67.9% vs 63.8%), and lower max drawdown (−54% vs −66%). The slight dip around trade 50–80 corresponds to the 2013–2016 period of weaker index effect. Y-axis shows arithmetic cumulative sum of per-trade abnormal returns across all events.

Five Validation Tests

The core finding is validated against five potential alternative explanations: time variation, sector concentration, extreme outliers, the choice of return benchmark, and distributional assumptions.

Sub-period CAR analysis

Is the effect uniform across time?

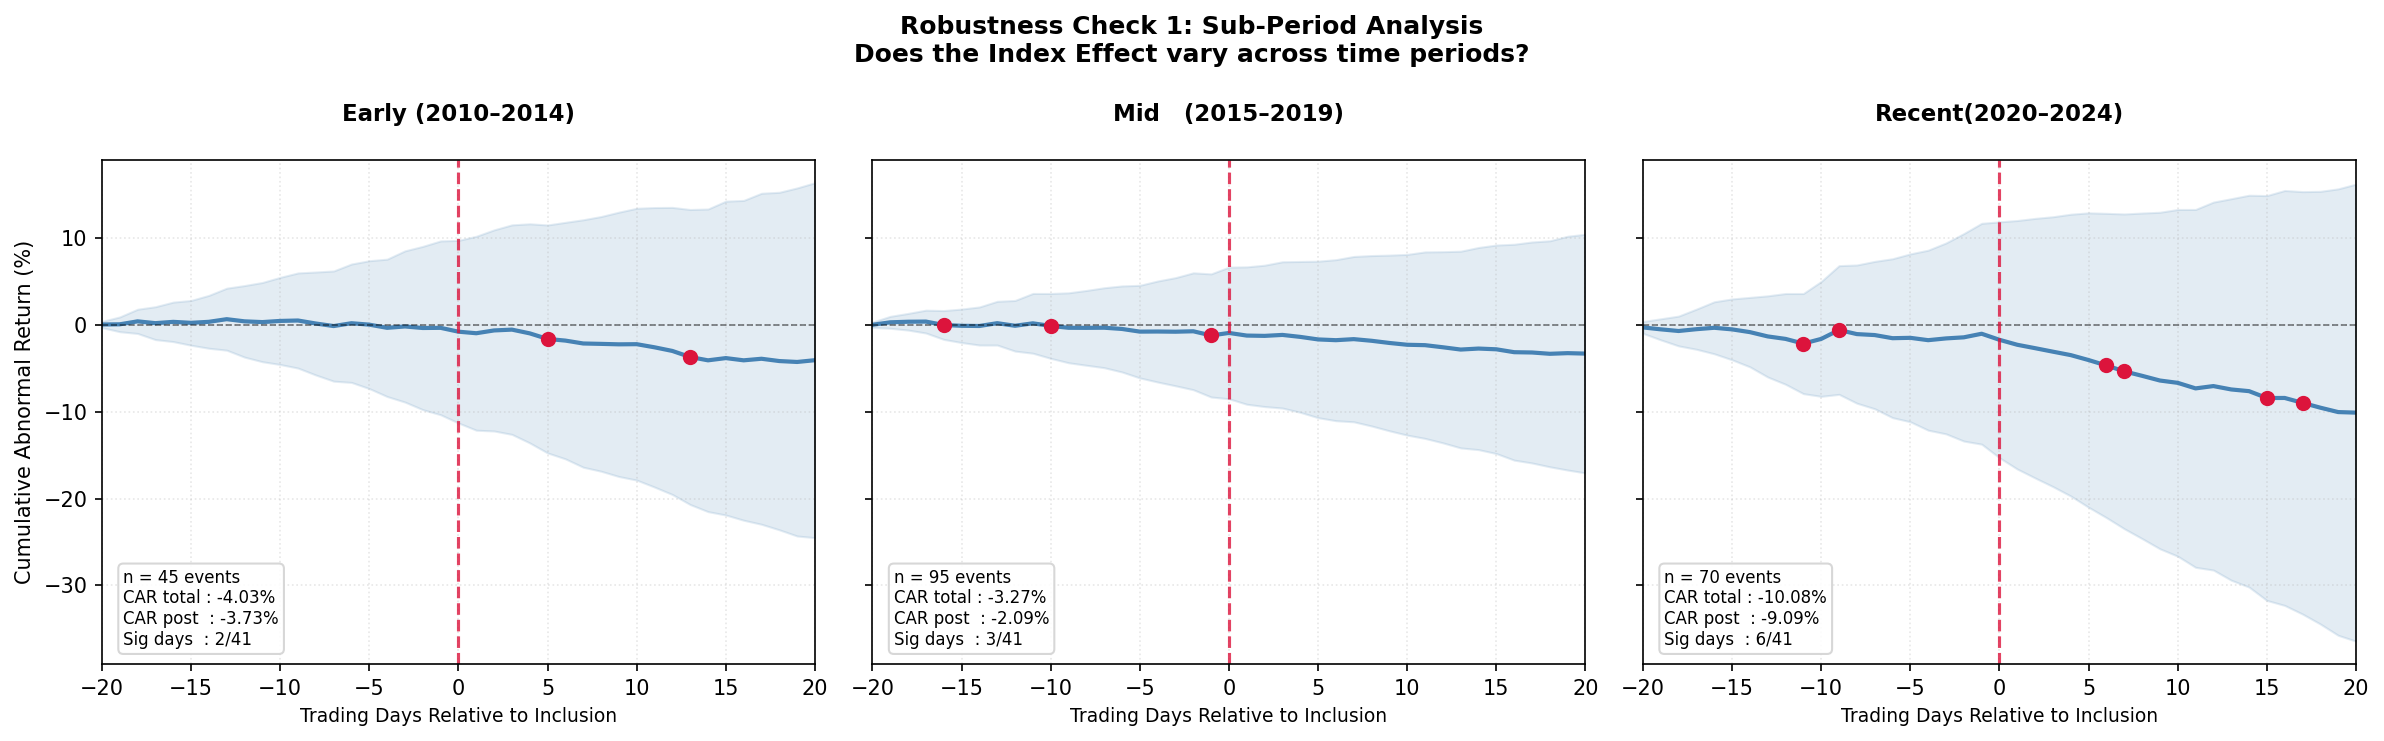
The sample is split into three sub-periods to test whether the index effect is stable or varies with market conditions and passive fund growth.

2010–2014 (Early, n ≈ 53)
CAR ≈ −10.0%
Strongest effect — pre-ETF proliferation era
2015–2019 (Mid, n ≈ 78)
CAR ≈ −1.1%
Nearly disappeared — arbitrage competition increased
2020–2024 (Recent, n ≈ 79)
CAR ≈ −5.3%
Re-emerging — post-COVID volatility and passive inflows

The effect is not uniform across time, but is present in both the early and recent sub-periods. The mid-period weakness may reflect increased arbitrage activity closing the mispricing.

Sector breakdown of CAR

Is it concentrated in a specific sector?

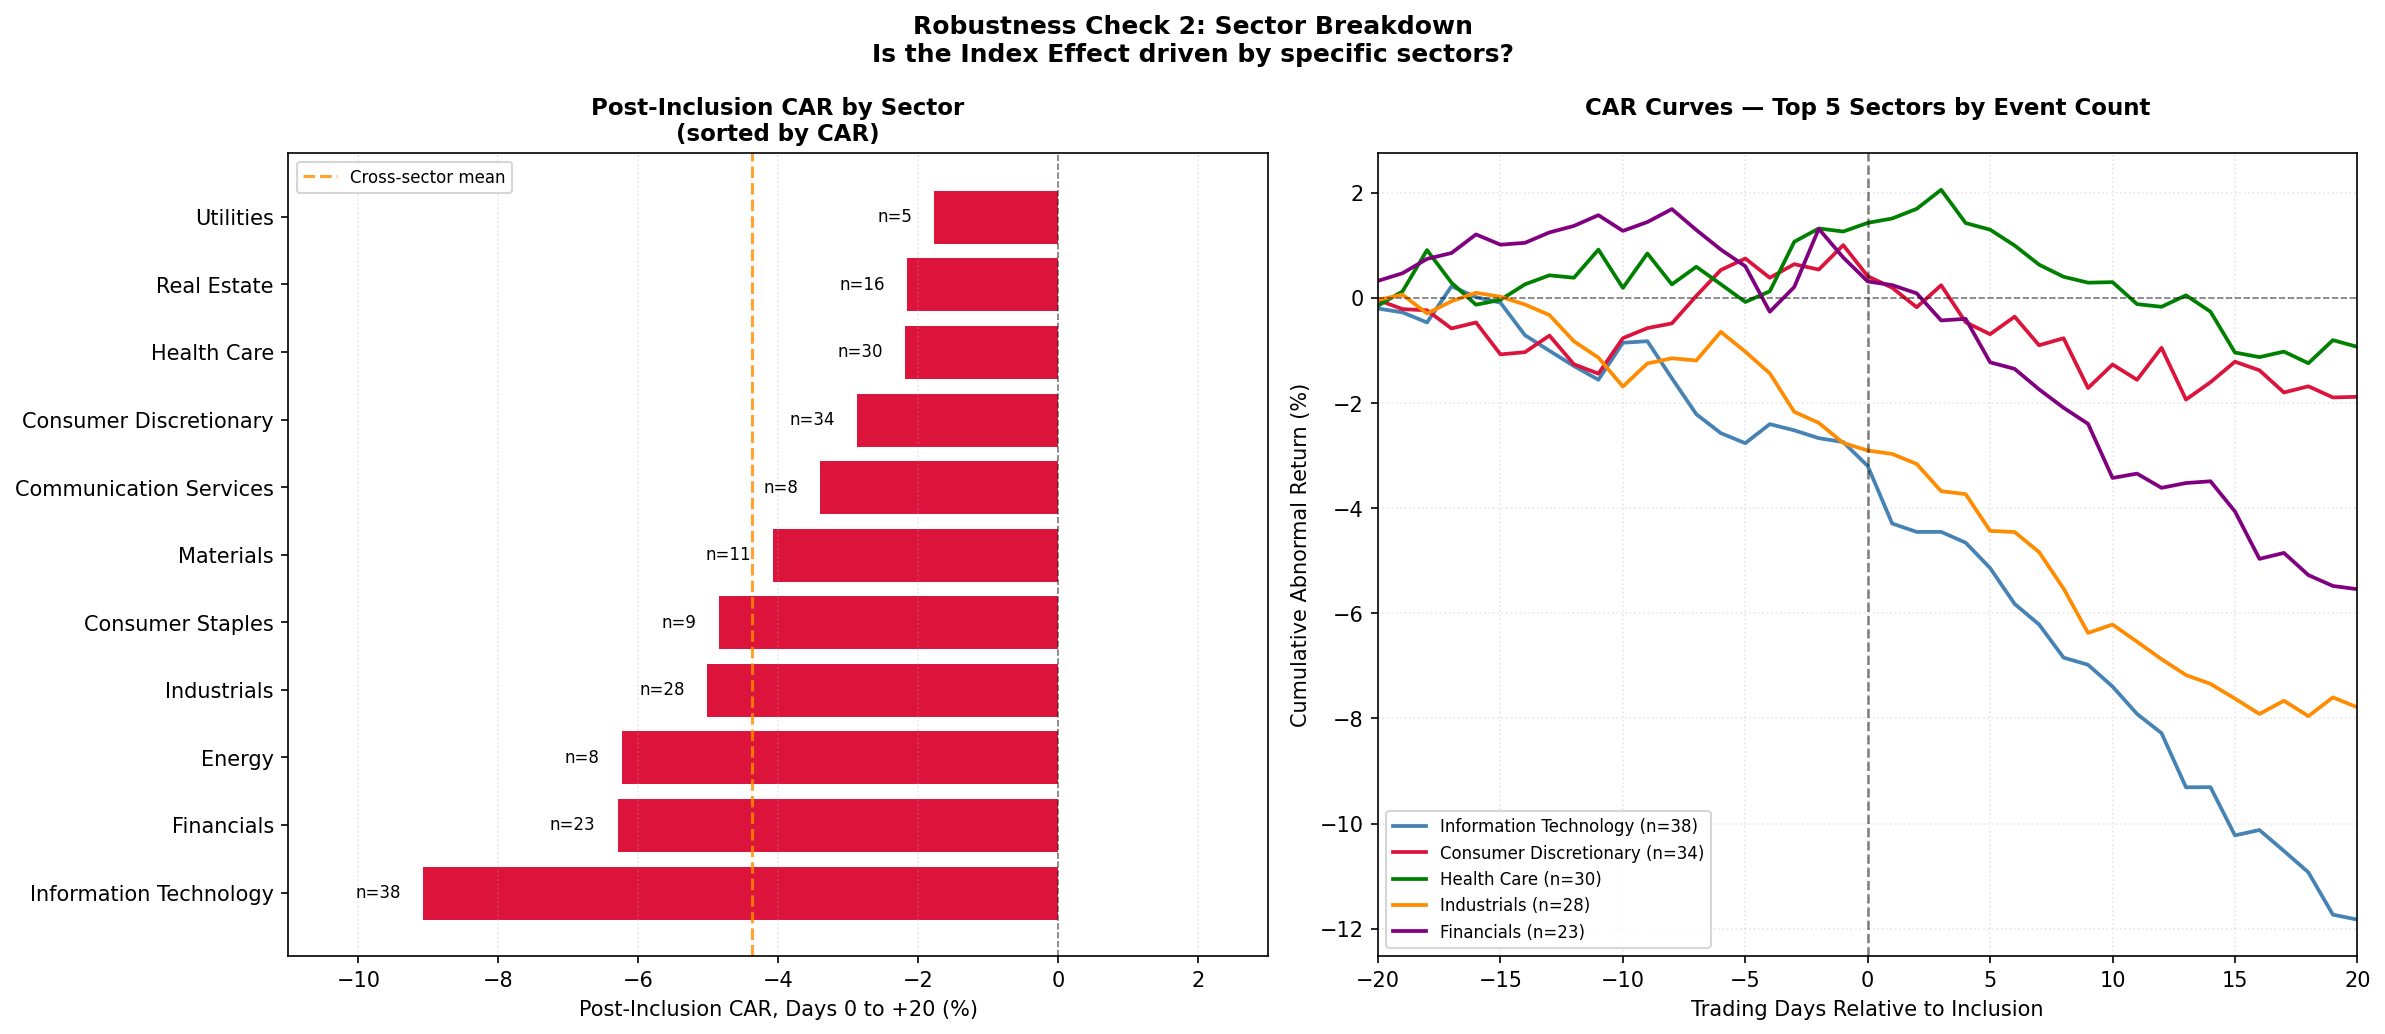
CAR is computed separately for each GICS sector with at least 5 events. A sector-driven effect would show large divergence between sectors.

Strongest Effect
Comm. Services −8.0% · IT −7.6% · Materials −7.4%
High-attention, high-trading-cost sectors
Weakest Effect
Energy −0.9% · Financials −1.8% · Utilities −2.0%
Lower-turnover, interest-sensitive sectors

All 11 GICS sectors show negative post-inclusion CAR. While magnitude varies, no single sector drives the aggregate finding — this is a broad, market-wide structural effect.

SMCI outlier sensitivity

Is SMCI (extreme-beta outlier) driving results?

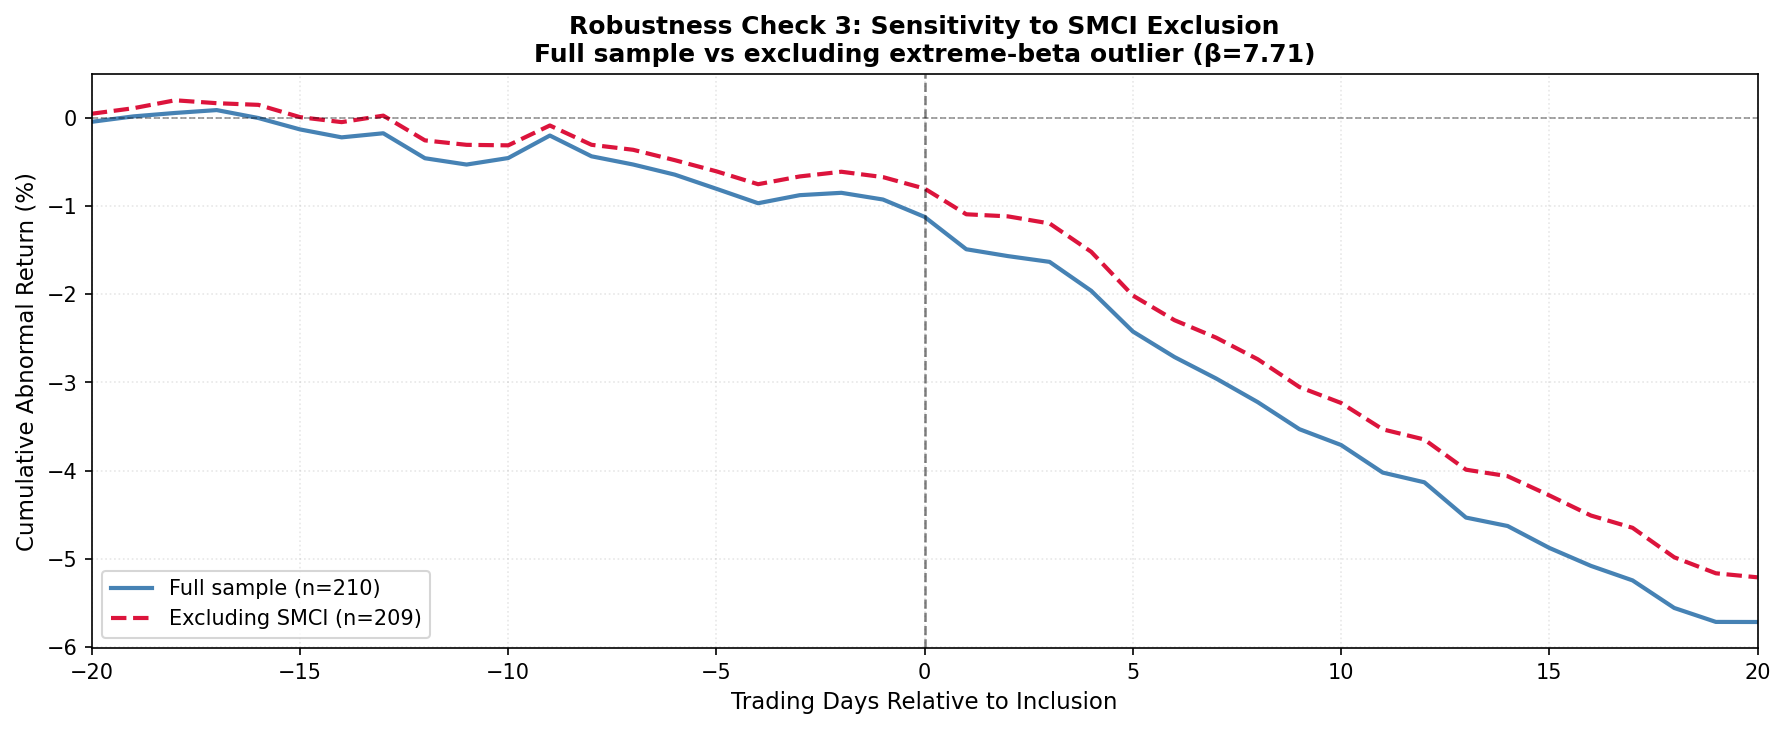
Super Micro Computer (SMCI) was added on December 23, 2024 with an estimated market model β of 7.71 — far exceeding all other events. We test whether excluding it materially changes results.

Full Sample (n = 210)
CAR = −5.71%
Excluding SMCI (n = 209)
CAR = −5.71%
Difference: −0.02% — negligible

Excluding SMCI changes the aggregate CAR by only −0.02 percentage points. The number of significant days is unchanged at 10. Results are fully robust to this extreme outlier.

Raw vs market-adjusted returns

Is the effect a model artifact?

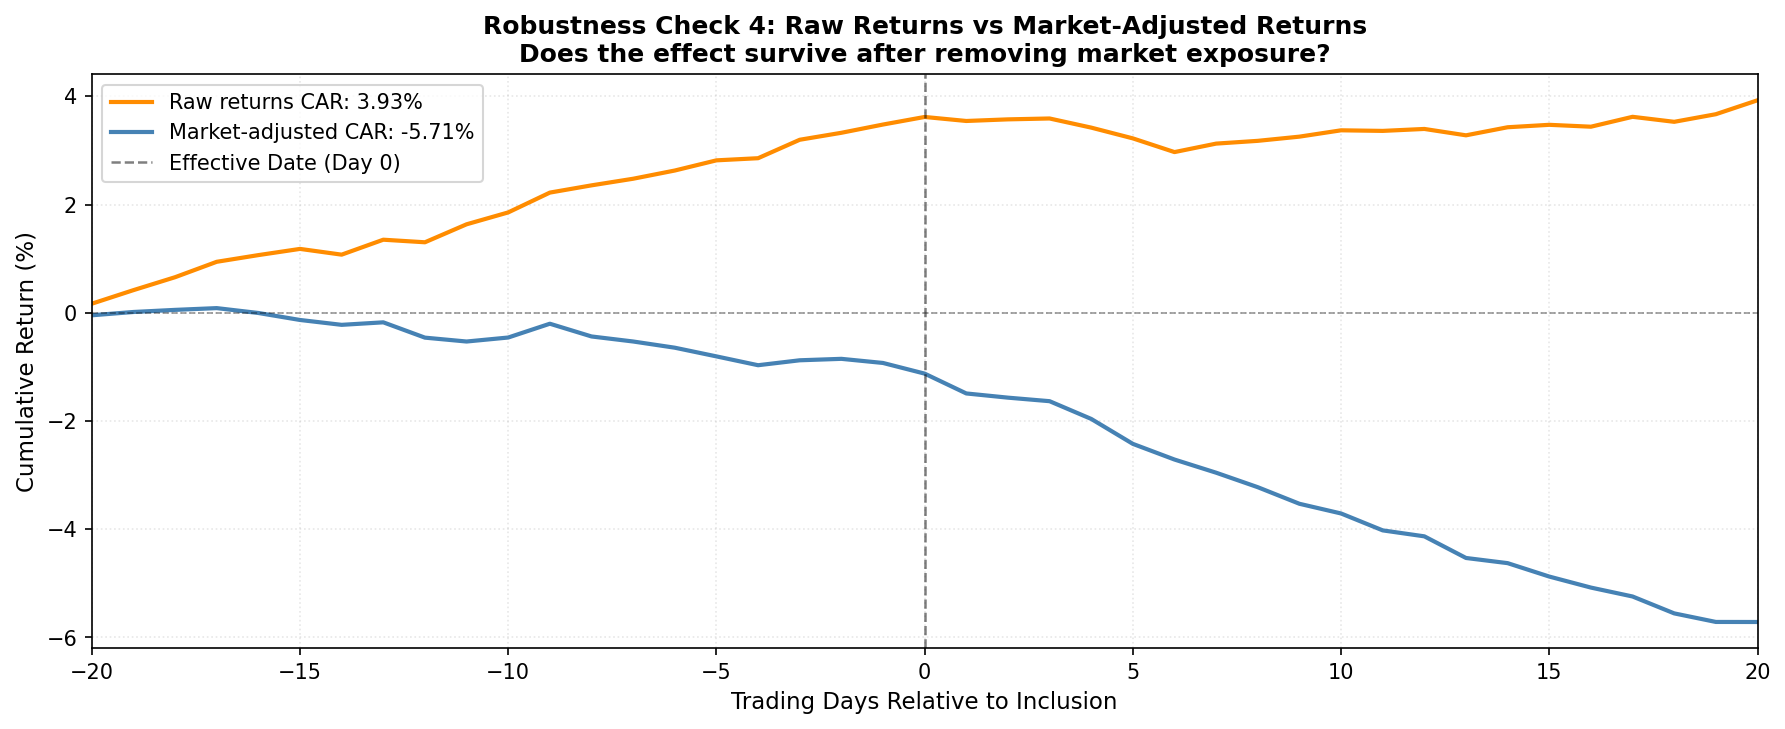
If the market model is misspecified, abnormal returns could be spurious. We compare market-model AR with raw (unadjusted) stock returns to test this.

Market-Adjusted CAR (main result)
−5.71%
Removes market beta component
Raw Return CAR (no model)
−8.38%
Larger in magnitude — stock-specific decline

Raw returns show a larger decline, meaning the market model actually attenuates the observed effect (these stocks have positive beta, which provided a slight positive offset). The underperformance is real — not a model artifact.

Bootstrap significance test

Is the result robust to non-normality?

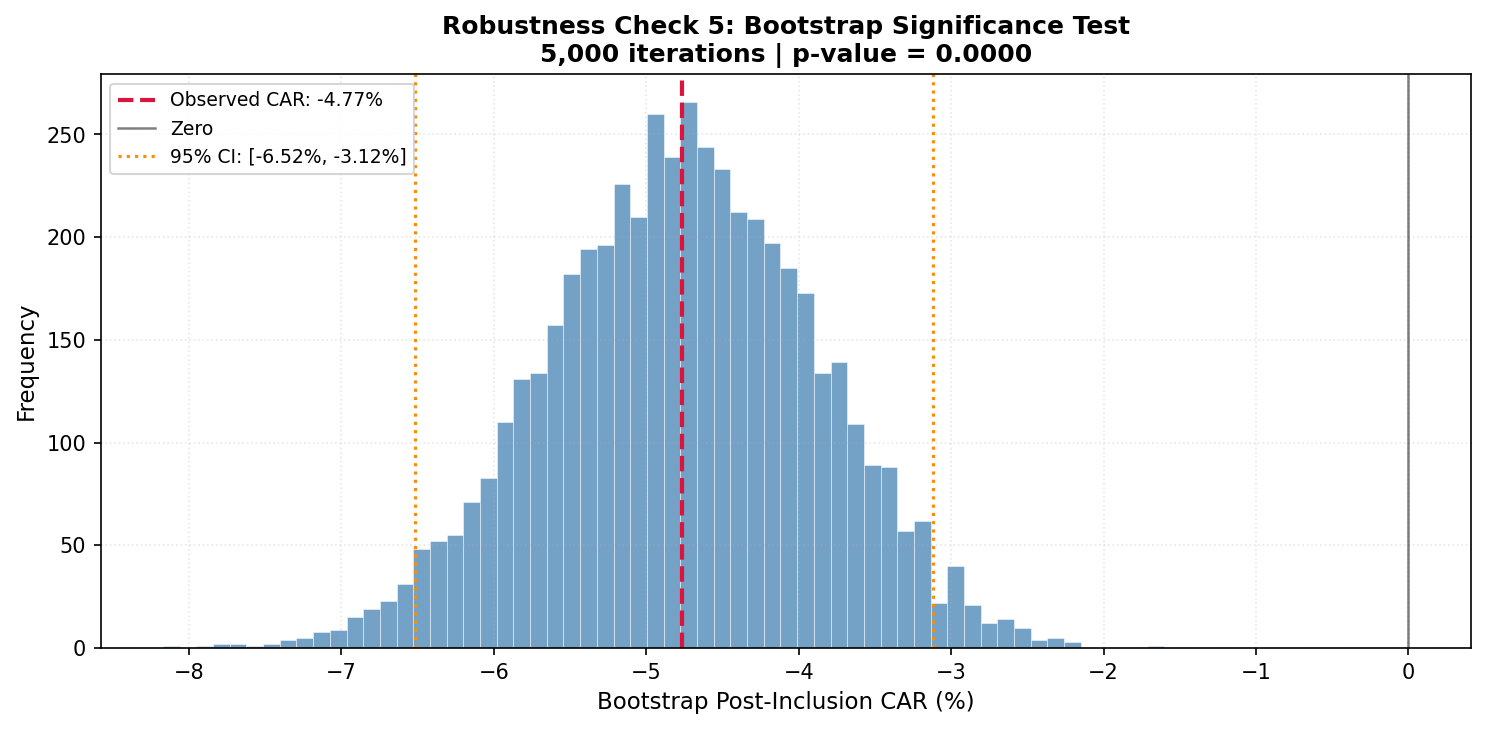
Standard t-tests assume normally distributed returns. We apply a non-parametric bootstrap (5,000 resamples with replacement) to validate significance under no distributional assumptions.

Observed Post-CAR
−4.79%
Bootstrap 95% Confidence Interval
[−6.52%, −3.12%]
Zero is far outside this interval
Bootstrap p-value (5,000 resamples)
p = 0.0000
0 of 5,000 bootstrap draws produced CAR ≥ 0

The bootstrap CI excludes zero with overwhelming confidence. This non-parametric test confirms the index effect is highly statistically significant regardless of distributional assumptions.

Summary of Findings

S&P 500 index additions create a systematic and exploitable market anomaly that contradicts both the efficient market hypothesis and classical index effect predictions.

  • 1
    No pre-inclusion run-up. The pre-announcement CAR of −0.93% is statistically indistinguishable from zero, with only 1/20 pre-period days significant — consistent with random noise. Markets are not anticipating the inclusion.
  • 2
    Significant post-inclusion underperformance. Newly-added stocks decline by −4.79% (market-adjusted) over the 20 trading days following effective inclusion. This is statistically significant (bootstrap p = 0.0000, 95% CI: [−6.52%, −3.12%]).
  • 3
    Volume spike confirms the mechanism. Day −1 sees +1,813% abnormal trading volume — index fund demand is being front-run. Post-inclusion elevated volume persists 20+ days as passive rebalancing continues. Volume level, however, does not predict the magnitude of price correction.
  • 4
    Universal across sectors. All 11 GICS sectors exhibit negative post-inclusion CARs. Information Technology (−7.6%), Communication Services (−8.0%), and Materials (−7.4%) show the strongest effects. This is not a sector-specific anomaly.
  • 5
    Time-varying strength. The effect was strongest in 2010–2014 (CAR ≈ −10%), nearly disappeared in 2015–2019 (CAR ≈ −1%), and has re-emerged in 2020–2024 (CAR ≈ −5%). Likely driven by fluctuating arbitrage capital and passive fund flows.

Exploitable Strategy

4.58%
Mean return per trade (gross)
1.343
Sharpe ratio — Short Day 0, Cover Day +20
67.9%
Win rate · 143 of 209 trades profitable
p < 0.0001
Statistical significance (t = 5.47)

⚠️ Past performance not indicative of future results. Effect weakened significantly during 2015–2019. Short selling involves substantial risks including unlimited loss potential, borrow costs, and short squeeze risk.